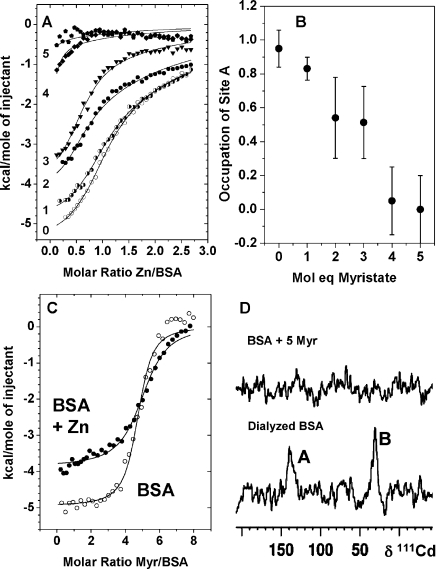
Figure 5.
Competitive binding of metals and MYR to BSA. (A) Effect of increasing amounts of MYR on the zinc-binding capacity of BSA. ITC curves for titrations of 333 μM Zn2+ into 25 μM BSA in the presence and absence of varying amounts (0–5 molar equiv) of MYR in 50 mM Tris/50 mM NaCl (pH 7.2). The fits (Figure S8) allowed estimates of the ratio of site A availability, as shown in (B). A clear downward trend was observed. A 4:1 MYR:Zn molar ratio suppressed occupation of site A almost completely. A second binding site was also affected by fatty acid binding (see D). (C) ITC curves for titrations of 500 μM MYR into 12.5 μM BSA or Zn1BSA. These titrations were carried out in H2O because of the insufficient solubility of MYR in Tris buffer. The fits (Figure S9) correspond to a model with one set of binding sites to estimate the stoichiometry for the highest-affinity sites. This equaled 5.0 ± 0.3, and the average log K was 6.3 ± 0.4 in the absence and 5.9 ± 0.4 in the presence of Zn2+. More complex fits were possible, but the data were insufficient to justify them. (D) 111Cd NMR spectra of Cd2BSA recorded in the absence and presence of 5 molar equiv of MYR. Peaks A and B were both suppressed by MYR.

