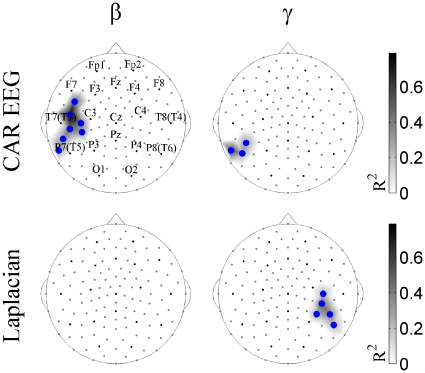
Figure 4. Surface topography of correlations between MPS and Liddle's factor of disorganization for NAC vs. Placebo contrast.
Significant Pearson correlations at FDR<0.05 are shown in the alpha (α) and beta (β) frequency bands for CAR EEG and Laplacian data. Blue circles designate the sensors with inverse correlations. The size of the correlations is reported as the coefficient of determination defined as the square of the Pearson correlation value (R2).

