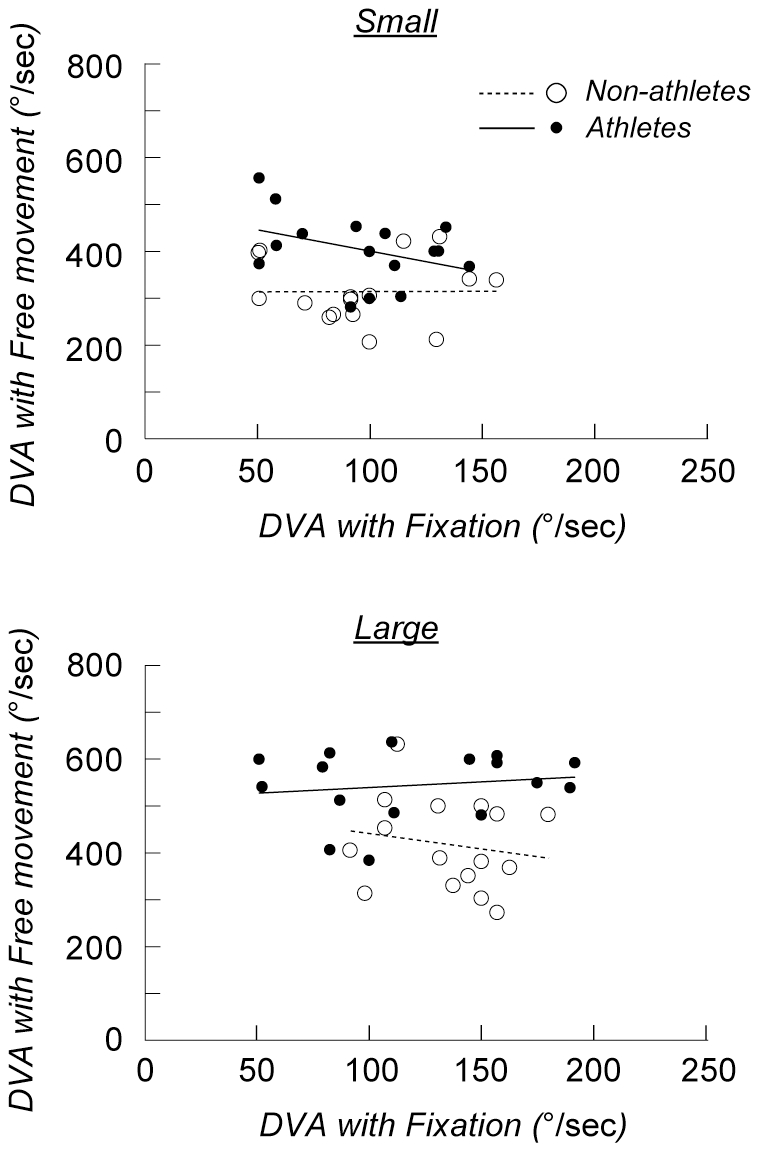
Figure 4. Correlations between DVA in the fixation and free-eye-movement conditions.

DVA in the free-eye-movement conditions is plotted against DVA in the fixation conditions for each athlete (filled circles) and non-athlete (open circles). The lines show the results of the linear regression analysis. There was no significant correlation in either group for the small (top) or large targets (bottom) (p>0.1).
