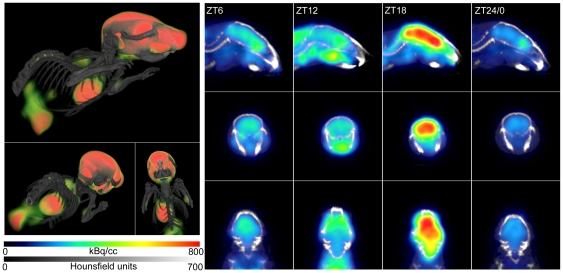
Figure 1. Fused CT and PET images from individual representative C57Bl/6 mice.
The left panel shows a 3D reconstruction of a mouse measured in the middle of the dark phase of the light-dark cycle, where brain, heart and bladder show high FDG uptake. Both kidneys and the interscapular brown adipose tissue are also visible. Colors indicate only mid-range FDG uptake, where green is lower and red is higher uptake. On the right, representative individuals from the 4 groups measured at (from left to right) ZT6, 12, 18 and 24/0 are depicted. Images are shown for sagittal (top), coronal (middle) and transverse (bottom) planes. Scale bars belonging to the right panel for CT intensity (represented as gray-scale) and FDG uptake (in color) are shown on the bottom left.

