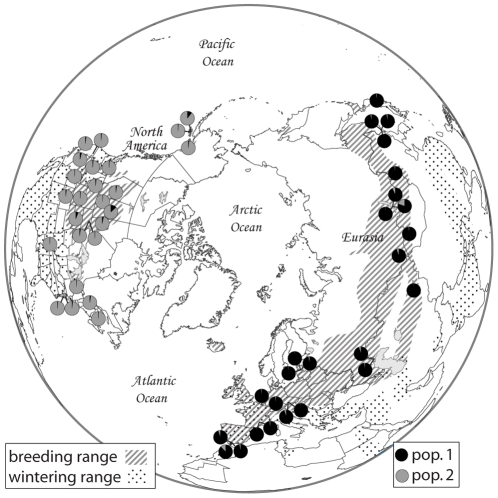
Figure 1. Sampling locations and population assignment probabilities.
Assignment probabilities are based on genotypes from 22 non-coding loci for 50 gadwalls. Note that all 25 individuals sampled from the OW were assigned to population 1, and all 25 individuals sampled from the NW were assigned to population 2 with high assignment probabilities.

