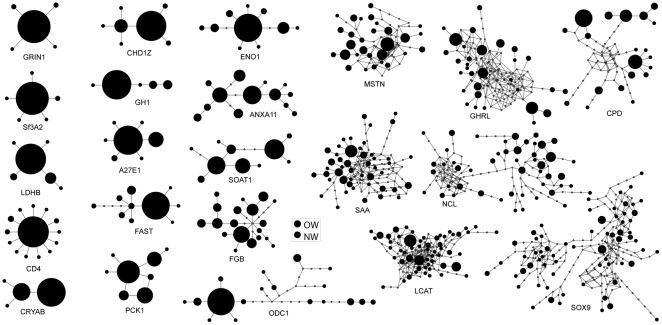
Figure 3. Haplotype networks.
Haplotype networks illustrating the heterogeneity in genetic diversity among 22 non-coding loci sequenced from gadwalls. The area of the circles is proportional to the number of alleles occurring in the total sample (N = 50); substitutions are shown as branches between the alleles. See Table 1 for full gene names.

