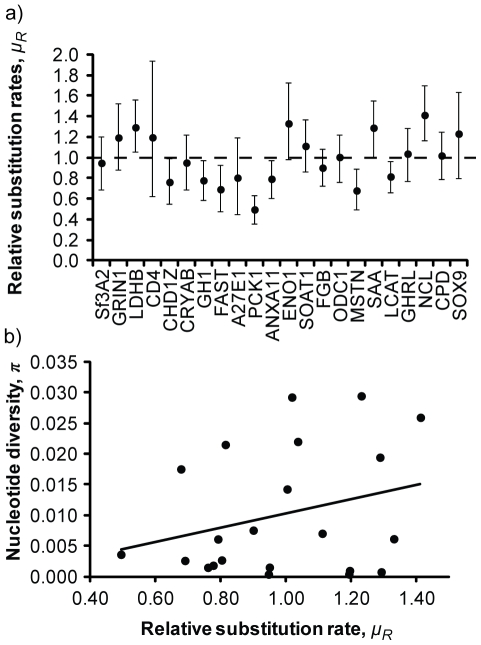
Figure 4. Substitution rates and genetic diversity.
(a) Estimates of relative substitution rates (μR) and their 95% higest posterior densities based on the analyses of eight taxa in *beast; loci are ranked on the x-axis (lowest to highest) by values of nucleotide diversity within gadwalls, and the horizontal dashed line indicates the mean relative rate (1.0 by definition). (b) Relationship between μR and nucleotide diversity within gadwalls.

