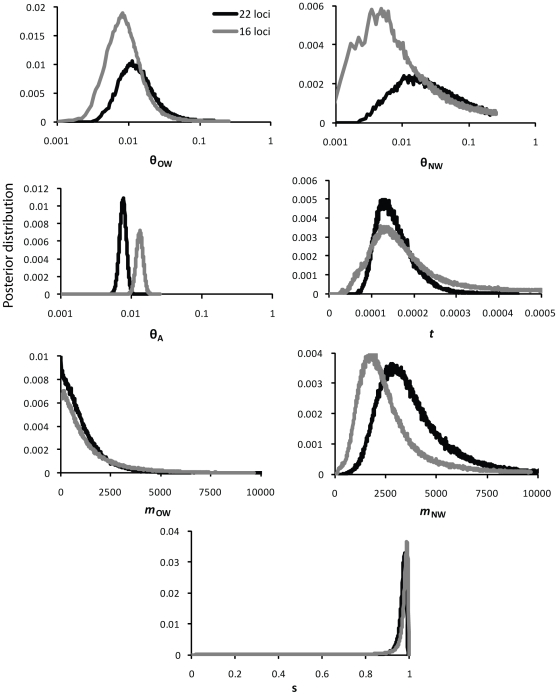
Figure 6. Isolation-migration model results.
Posterior distributions of the seven parameters estimated using the isolation-migration model of population divergence. Heavy lines are the posterior distributions from the analysis of the full 22-locus dataset; light lines are from the analysis of the 16-locus dataset excluding six loci that may be under selection. Values are rescaled to the per-site substitution rate.

