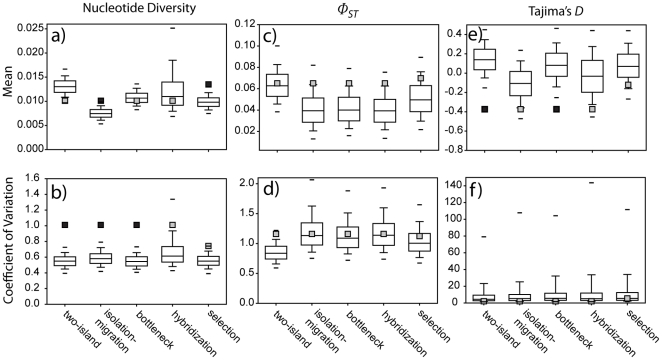
Figure 7. Goodness-of-fit tests of five models of population history.
Box plots indicate the posterior predictive distributions of the mean (a, c, e) and coefficient of variation (b, d, f) for nucleotide diversity (a, b), Φst (c, d), and Tajima's D (e, f) simulated for a 22-locus dataset (or a 16-locus dataset in the selection model) with 1,000 replicates; horizontal lines indicate the 95% confidence limits. Lightly shaded squares mark the values for empirical data that fell within the 95% confidence intervals; dark shading indicates empirical values that fell within the 2.5% tails of the posterior predictive distributions.

