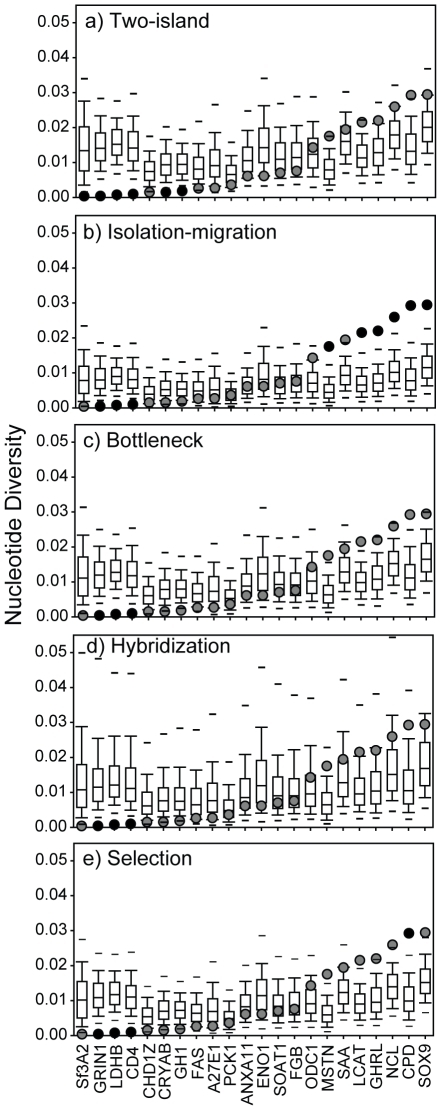
Figure 8. Goodness-of-fit tests of locus-specific nucleotide diversity from five models of population history.
Box plots indicate the posterior predictive distributions for each locus (1,000 replicates; horizontal lines indicate the 95% confidence limits). Light-shaded circles mark the values for empirical data that fell within the 95% confidence intervals, whereas dark-shaded circles mark significant outliers (after applying a correction for the false discovery rate). GRIN1, LDHB, and CD4 consistently deviated from the simualted values. Loci are ranked on the x-axis by nucleotide diversity.

