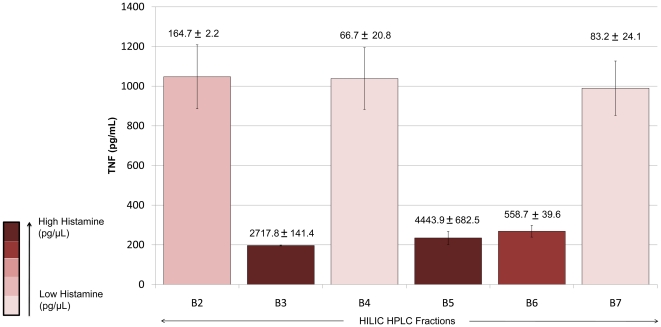
Figure 3. Quantification of histamine by triple quadrupole mass spectrometry.
Histamine in HILIC-HPLC fractions B2–B7 from L. reuteri 6475 grown in a glucose-containing medium was quantified by triple quadrupole mass spectrometry. The y-axis indicates TNF production from activated human monocytoid cells. The concentration of histamine (pg/µL) is indicated above each bar graph. Elevated levels of histamine correlated with TNF inhibition.

