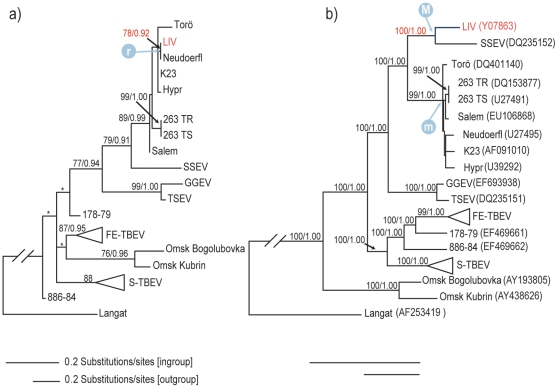
Figure 3. Most likely phylogram from the maximum likelihood analysis of the partitioned NS3-gene.
The partitions of NS3 correspond to (a) the recombinant fragment nt 1320–1524, (b) nt 1–1319 concatenated with nt 1525–1866. Numbers above nodes indicate branch support (bootstrap support ≥70%/Bayesian posterior probability ≥0.90). Asterisks (*) mark nodes that that are not recovered by Bayesian inference. Bars show different amounts of substitution for the in-group and out-group taxa. The position and branch support of LIV are indicated in red. “M” and “m” refers to the divergences of the major parent and minor parents respectively, while “r” points to the recombination event in the tree. Genbank accessions are indicated in parentheses.

