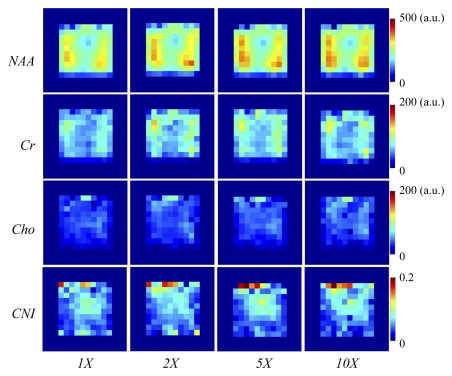
Figure 3:
Comparative metabolite maps of NAA, creatine (Cr), choline (Cho), and choline-to-NAA index (CNI) for a healthy brain data set for the acceleration factors of one (1X), two (2X), five (5X), and 10 (10X). The yellow box on the MR anatomic image (Fig 1) indicates the MR spectroscopic imaging region of interest depicted on the maps. a.u. = arbitrary unit.

