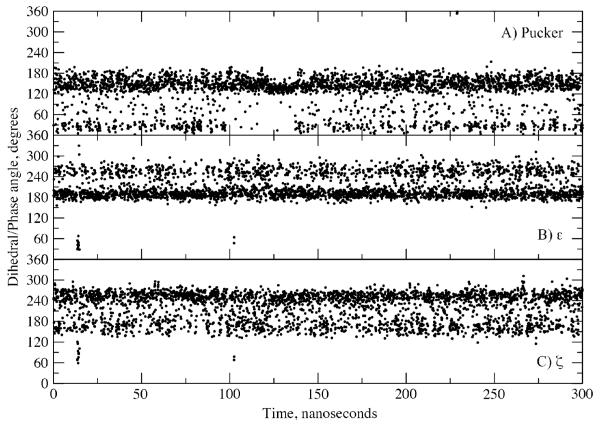
Figure 7.
Time series from EcoRI C27_2b simulation for A) sugar puckering of strand 1, nucleotide 3, B) ε of strand 1, nucleotide 4 and C) ζ of strand 1, nucleotide 4. Data points are shown for every 100 ps. See Figures S6, S7 and S8 of the supporting information for all puckering, ε and ζ time series. Note that in the BI state ε and ζ are approximately 190° and 270°, respectively, and in the BII state they are approximately 270° and 180°, respectively.

