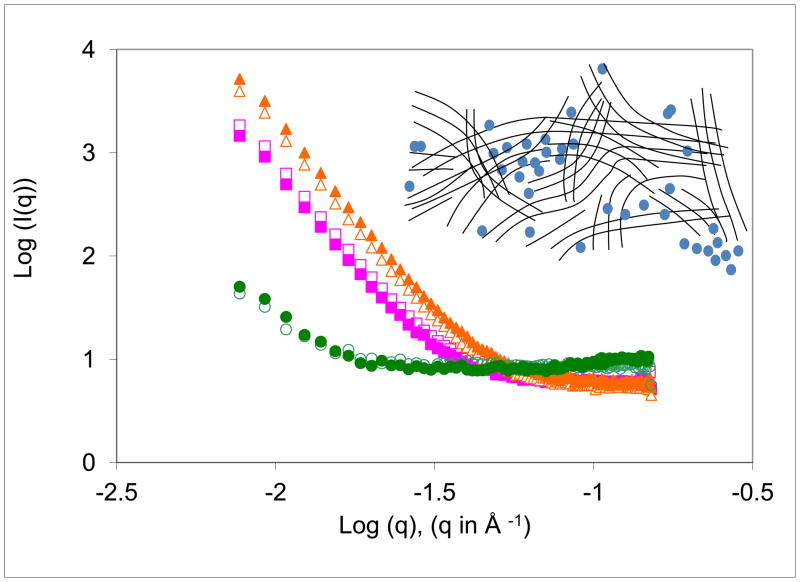
Figure 5.
SANS intensity vs. scattering angle for the three films used in this study. Squares - poly(DTE adipate). Triangles - poly(DTE glutarate. Circles - poly(DTB succinate). Open symbols refer to quenched films, and the filled symbols to the annealed samples. The inset shows a schematic of the fluctuation in the distribution of water shown by filled blue circles in the polymer matrix represented by lines.

