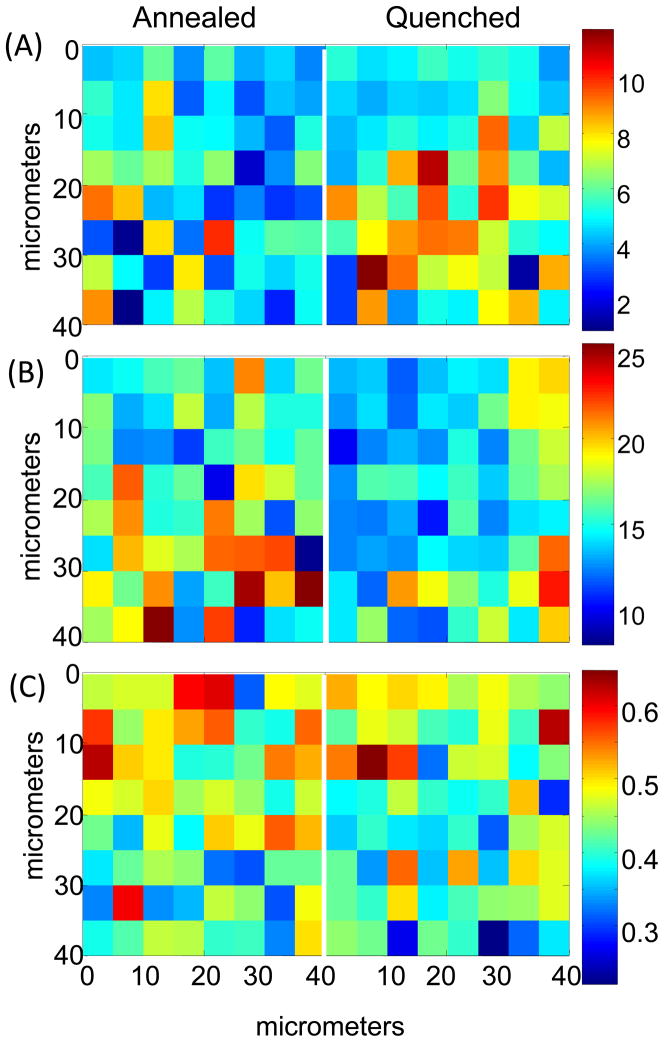
Figure 6.
Confocal Raman images of relative D2O content measured by integrated band area ratio (D2O stretch/C=C stretch) (2170–2776 cm−1)/(1578–1628 cm−1) for (A) poly(DTE adipate), (B) poly(DTE glutarate) and (C) poly(DTB succinate) samples after 65 days of incubation in D2O at 37°C. Data from both annealed and quenched samples are shown. Spectra acquired 20–30 microns from top edge of polymers. NOTE: separate scale bars for each polymer. The vertical axis corresponds to depth from the top surface of the film. The color scale bar represents relative D2O content as determined by integrated band area ratio (D2O stretch/C=C stretch) with red being the largest ratio, and blue the smallest.

