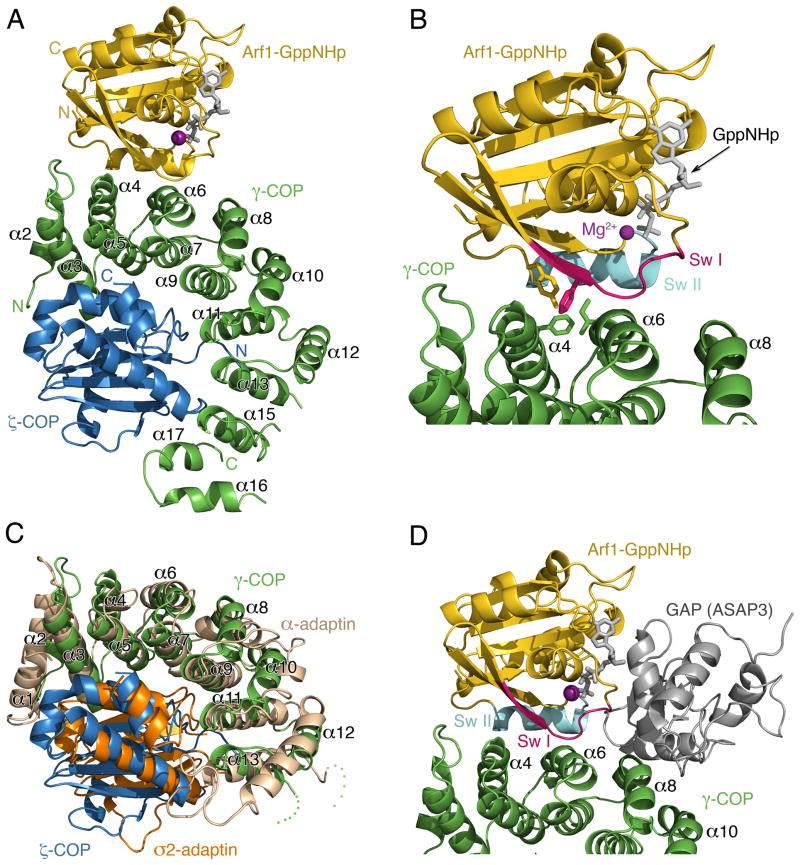
Figure 3. Crystal Structure of γζ-COP Complexed with Arf1-GppNHp.
(A) Ribbon diagram with γ-COP colored green, ζ-COP blue and Arf1 gold. The α helices of the γ-COP α-solenoid domain are labeled according to the scheme introduced by Collins et al. (2002) for the AP2 adaptor complex (γ-COP is related to the α-adaptin subunit of AP2).
(B) Close up view in the same orientation as (A). The switch I and II elements of the G protein are indicated (red and cyan, respectively), and the side chains of several key interfacial residues are included (a more detailed analysis of interfacial residues is presented in Figure 4).
(C) Structural overlap of γζ-COP and the corresponding region of the ασ-adaptin dimer of AP2 (Collins et al., 2002). γ- and ζ-COP are colored green and blue as before; σ2-adaptin is orange and α-adaptin is light brown.
(D) A composite molecular model that includes the GAP catalytic domain of ASAP3, taken from the crystal structure of ASAP3 bound to Arf6 (Ismail et al., 2010). The model was created by superimposing the Arf6 and Arf1 structures. The picture is oriented as in (A).

