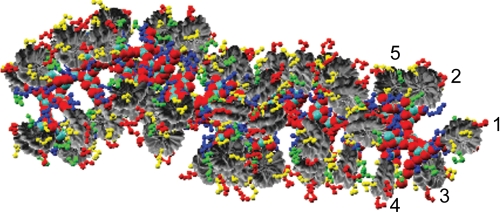
FIGURE 2.
Detailed view of the heteromorphic chromatin model shown in Fig. 1, with rendering of the core histone tails to show the complex inter- and intranucleosome interactions. The first five nucleosomes are marked to indicate the different interaction types. Histone tails are colored yellow (H2A), red (H2B), blue (H3), and green (H4).

