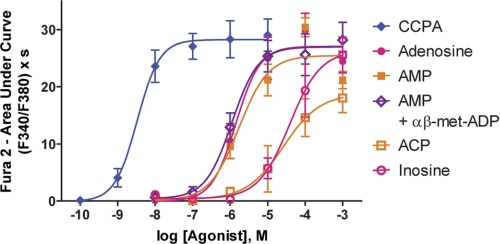
FIGURE 3.
Dose-response curves for adenosine, AMP, and related analogs at hA1R. Calcium mobilization was measured in HEK293 cells expressing hA1R + Gqi and stimulated with the indicated compounds. For the AMP + αβ-met-ADP condition, cells were incubated with 10 μm αβ-met-ADP for 3 min and then stimulated with AMP in the presence of 10 μm αβ-met-ADP. AUC measurements extended for 1 min from agonist addition. All experiments were performed in duplicate. n = 19–45 cells per condition. All data are presented as means ± S.E.

