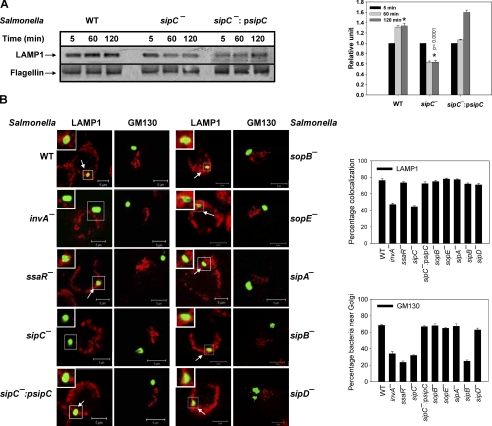
FIGURE 4.
Recruitment of LAMP1 on SCP. A, Western blot showing levels of LAMP1 on indicated purified phagosomes (80 μg of protein per lane). Flagellin was used as a loading control. Right panel of the figure indicates quantification of the data by densitometry. Results are represented as mean ± S.D. of three observations, normalized to the loading control. The amount of LAMP1 present on respective 5-min phagosome is arbitrarily chosen as 1 unit. Data from three independent experiments were analyzed by t test, and the significance is indicated by p values between the respective 120 min phagosomes (*). B, confocal image showing the localization of respective Salmonella (green) near Golgi (labeled with GM130-red) or their colocalization with LAMP1 (red), after 120 min of internalization into macrophages. Salmonella was visualized by probing with Salmonella H antiserum followed by Alexa 488-labeled anti-rabbit secondary antibody. Image represents a single x/y plane of a Z-section, and arrows indicate colocalization. Inset shows the enlarged region. The graphs represent the percentage of SCP positive for LAMP1 or in vicinity of Golgi from at least 50 observations.

