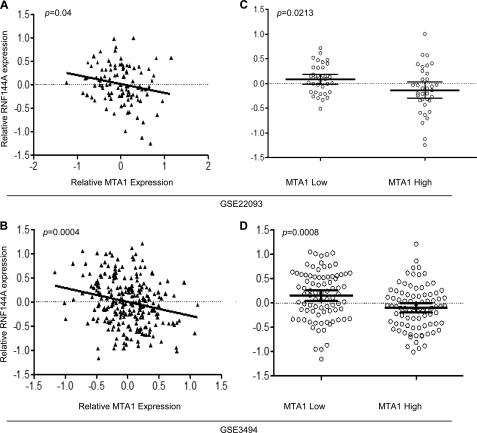
FIGURE 1.
A and B, correlation between transcript levels of MTA1 and RNF144A in breast cancer dataset sGSE22093 (n = 103, Pearson's r = −0.20, p = 0.04) (A) and GSE3494 (n = 251, Pearson's r = −0.22, p = 0.0004) (B). C and D, correlation between transcript levels of RNF144A levels in patients with high and low MTA1 levels in breast cancer datasets GSE22093 (p = 0.0213) (C) and GSE3494 (p = 0.0008) (D).

