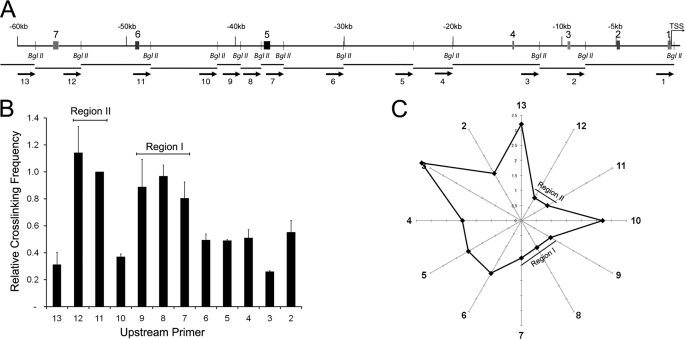
FIGURE 6.
Long range hes1 CRM-promoter interactions in C2C12 cells. A, schematic representation of the hes1 upstream sequence. Shaded boxes indicate the position of the hes1 CRMs. Small vertical bars represent the positions of the BglII restriction sites. Below, the restriction fragments generated by BglII digestion are annotated. Arrows indicate the location of the 3C qPCR primers. B, quantification of genomic interactions between the hes1 promoter region and the indicated upstream genomic fragments. The y axis shows the relative cross-linking frequency. The x axis indicates the primers used in combination with primer 1. Results are expressed relative to a BAC control containing equimolar amounts of all possible ligation products and are indicated as the mean relative cross-linking frequency ± S.D. of three independent experiments. C, graphical representation of the genomic distances between the hes1 promoter, positioned at the center of the radar, and the indicated BglII fragments. Distance was calculated as 1/cross-linking frequency.

