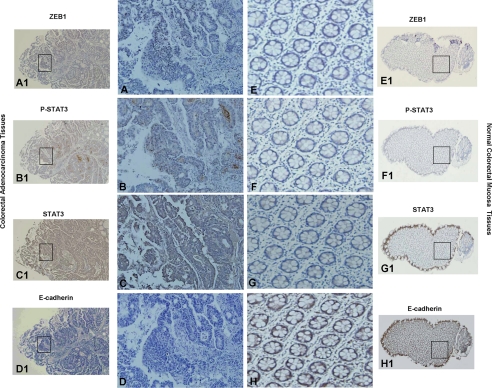
FIGURE 9.
Expressions of STAT3, ZEB1, and E-cadherin in CRC. Shown is immunohistochemical analysis of consecutive tissue sections for ZEB1, pSTAT3Tyr-705, STAT3, and E-cadherin in normal colorectal mucosa and high grade CRC. A and B, nuclear staining of ZEB1 and pSTAT3Tyr-705 were mostly presented in adenocarcinoma. Absent expression of ZEB1 (E) or pSTAT3Tyr-705 (F) was evident in the stroma or epithelium of the normal colorectal mucosa. C and G, cytoplasmic and nuclear staining of STAT3 was frequently detected in normal mucosa and adenocarcinoma. H, cytoplasmic staining of E-cadherin was predominantly detected in normal colorectal mucosa. D, staining of E-cadherin was dramatically decreased in adenocarcinoma, compared with normal colorectal epithelium. A–H (original magnification, ×200), representative areas from A1–H1 (original magnification, ×40), respectively.

