FIGURE 3.
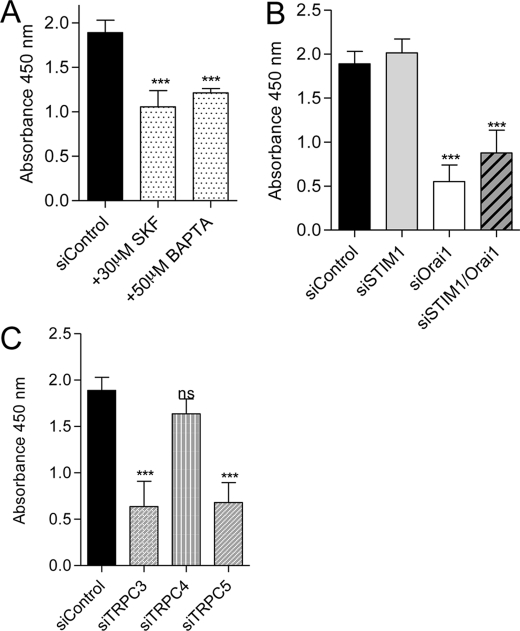
EA.hy926 cell proliferation assay. A, quantification of BrdU incorporation in control conditions and in the presence of 30 μm SK&F96365 and 50 μm BAPTA/AM. B, quantification of BrdU incorporation in EA.hy926 cells transfected with control siRNA and siRNA against STIM1, Orai1, and STIM1/Orai1. C, quantification of BrdU incorporation in EA.hy926 cells transfected with control siRNA and siRNA against TRPC3, TRPC4, and TRPC5. Data are mean ± S.E. (error bars) of minimum three independent experiments in duplicate. ns, not significant; ***, p < 0.001.

