
Figure 6. Comparison of product size effect (PSE) between the two subject groups.
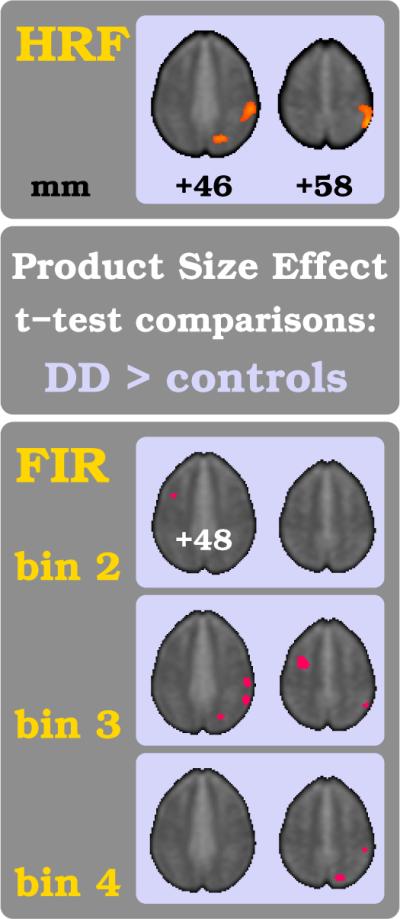
In the upper figure part the traditional HRF-based analysis results are shown for the comparison of healthy subjects versus individuals with DD. The lower figure part shows the results of the equivalent analysis in the FIR bin space for the three time bins 2–4. For each comparison a two-sample t-test was computed and threshold set at p < 0.01. The color-coding of tFIR-scores and other figure parameters are the same as in fig. 5.