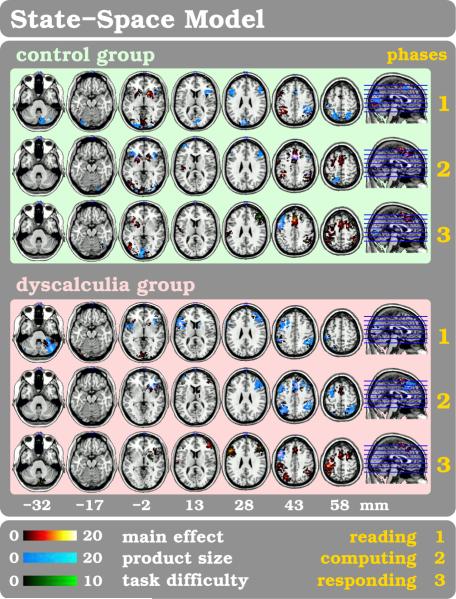
Figure 8. State Space Model for Mental Arithmetic.
The group-wise t-score maps are shown overlaid on axial slices of a high-resolution template brain image. Values t < 3 have masked out for clarity and the color-map shows values ranging from t = 3 to t = 16. Each row shows the activation maps corresponding to three phases (seeing, computing, responding) within a single trial of the task. Also displayed are the parametric modulations due to product-size effect during the seeing and computing phase, and the product-size and task-diffculty effects during the responding phase.

