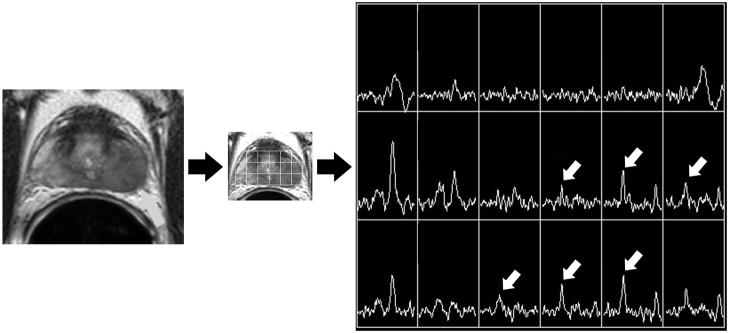
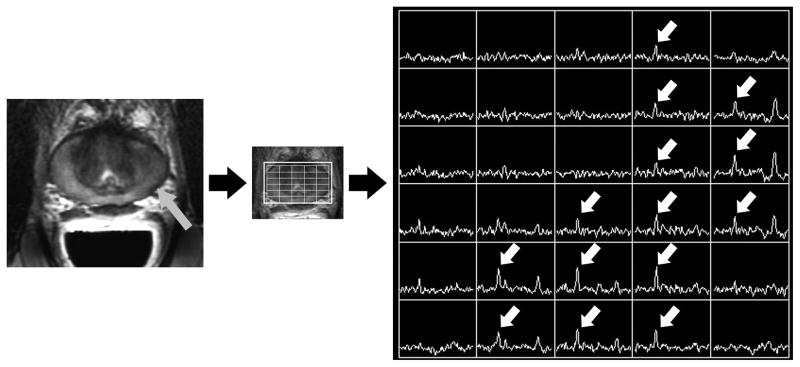
Figure 1.
Figure 1A. Photomontage of axial T2-weighted MR image, overlaid MR spectral grid, and corresponding MR spectra array in a 58 year old with recently diagnosed prostate cancer. A large mass-like focus (grey arrow) of reduced T2 signal intensity in the peripheral zone of the left mid-gland is associated with multiple voxels demonstrating high choline peaks (white arrows). This was considered the dominant tumor location.
Figure 1B. Photomontage of axial T2-weighted MR image, overlaid MR spectral grid, and corresponding MR spectra array obtained 4 years later, after treatment with external beam radiotherapy. Reduced T2 signal intensity (grey arrow) in the peripheral zone of the left mid-gland is associated with multiple voxels demonstrating high choline peaks (white arrows). This was considered the dominant recurrent tumor location, and matches the dominant location seen at baseline imaging.


