Figure 2.
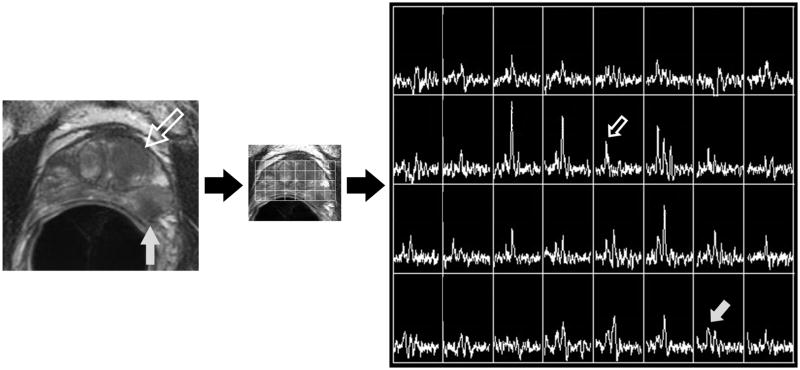
Figure 2A. Photomontage of axial T2-weighted MR image, overlaid MR spectral grid, and corresponding MR spectra array in a 67 year old with recently diagnosed prostate cancer. A large mass-like focus (large hollow white arrow) of reduced T2 signal intensity in the left central gland is associated with isolated choline elevation (small hollow white arrow white arrow). Readers considered this the dominant tumor location. A second smaller focus (large grey arrow) of reduced T2 signal intensity in the peripheral zone of the left mid-gland associated with relative choline elevation (small grey arrow) was not considered the dominant tumor location.
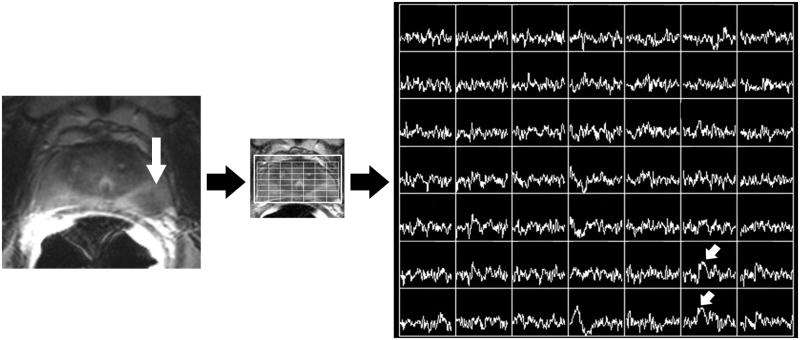
Figure 2B. Photomontage of axial T2-weighted MR image, overlaid MR spectral grid, and corresponding MR spectra array obtained 7 years later, after treatment with external beam radiotherapy. Reduced T2 signal intensity (large white arrow) in the peripheral zone of the left mid-gland is associated with high choline peaks (small white arrows). This was considered the dominant recurrent tumor location. This does not match the dominant location seen at baseline imaging, but in retrospect does correspond to the secondary tumor focus seen in Figure 2A.


