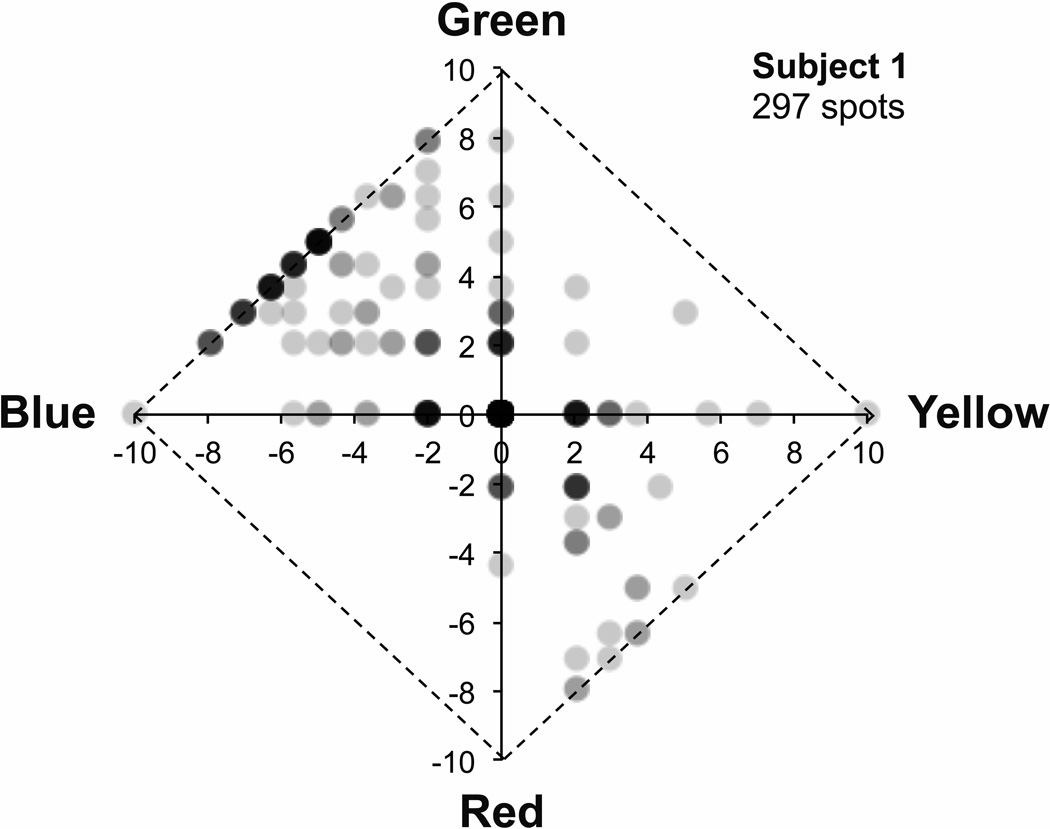
Figure 1.
Uniform Appearance Diagram illustrating typical variation in appearance of monochromatic (580 nm), threshold (20–85% seen), foveally viewed point stimuli for one subject (subject 1). The green minus the red rating (after the arcsine transform) is plotted vs the yellow minus the blue rating for each of 297 seen stimuli. Stimuli rated as purely white fall at the origin, while stimuli rated as purely colored (saturated) lie along the edges (diagonal lines) of the diagram. The weight of each point indicates the number of stimuli with that rating, with the darkest points representing the most stimuli. The variation in color appearance reported by this subject is typical, with stimuli often appearing white, green, blue-green, blue, yellow, red, or orange; seldom appearing yellow-green; and rarely appearing purple or violet.

