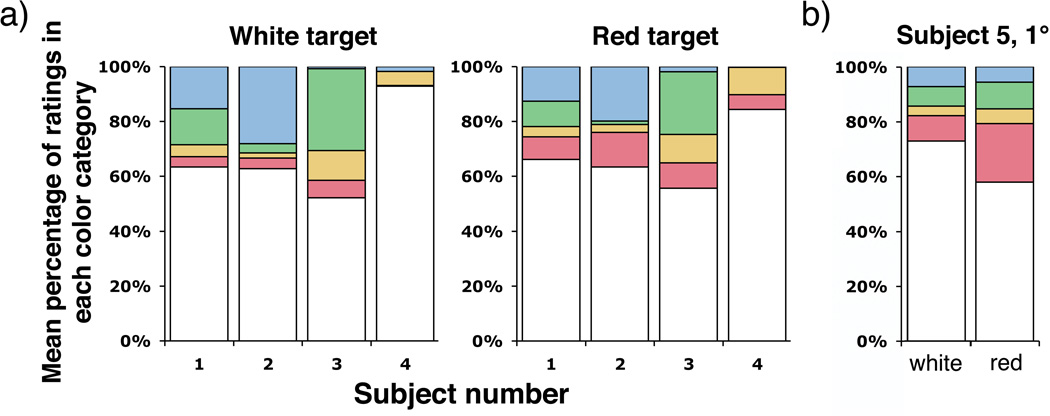
Figure 2.
A. Distribution of color ratings among the 5 categories: red, yellow, green, blue, and white; for 580 nm, threshold (20–85% seen), foveally presented point stimuli viewed when fixating red or white targets. B. Distribution of color ratings among the 5 color categories for subject 5, who viewed 580 nm, threshold (20–85% seen) stimuli at 1° while foveating a red or white fixation dot. Red ratings increased for all subjects when using the red fixation target than with the white target. The magnitude of the effect was roughly equal for all subjects, including subject 5 who used a foveal fixation point and more eccentric stimuli.

