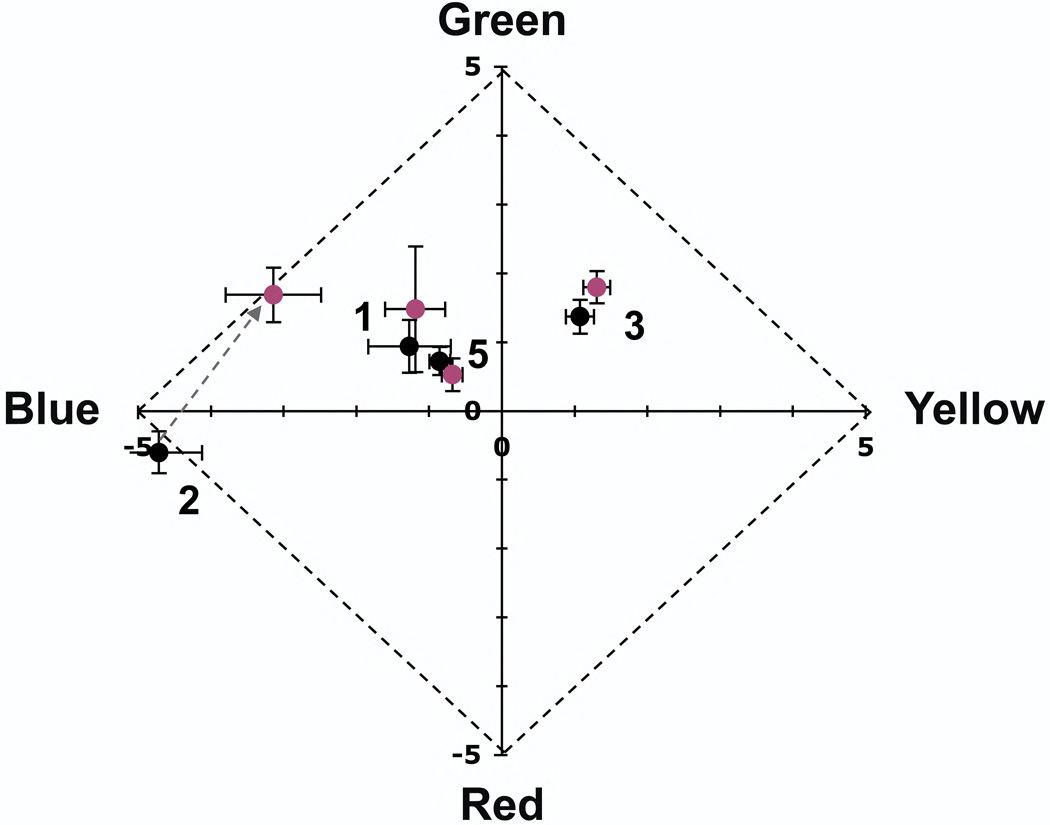
Figure 5.

Mean hue is significantly greener for 2 subjects (1 and 2) when viewing foveally presented, threshold, 580 nm stimuli with the correcting beacon present (reddish points) than without (black points). Mean hue was not significantly different for the other two subjects (3 and 5- only data for foveal stimuli displayed with conventional refraction are shown for subject 5, results with static aberration correction and stimuli presented at 1° were similar). Points are labeled with subject number and represent the average of all seen stimuli (Table 2), error bars are plus or minus 1 standard error. Note that only the central portion of the Uniform Appearance Diagram is shown.
