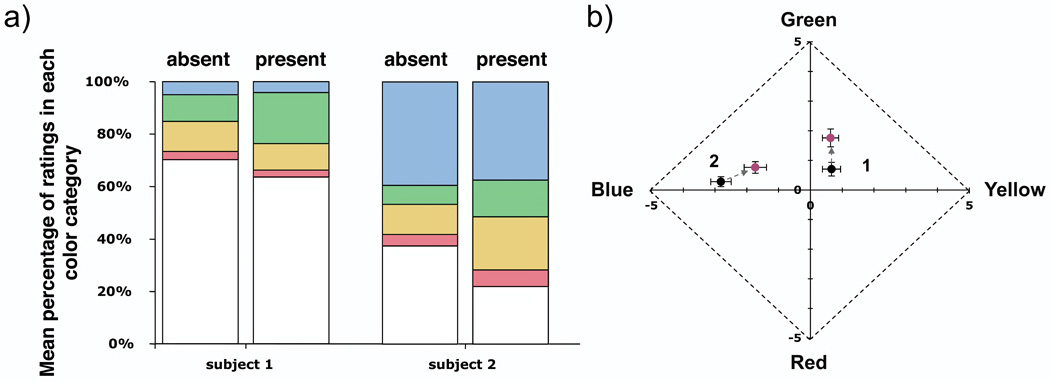
Figure 6.

Mean hue is significantly greener for 2 subjects (1 and 2) when viewing foveally presented, parathreshold (subject 1: 100% frequency of seeing, 0.45 log units above threshold; subject 2: 89% frequency of seeing), 580 nm stimuli with the correcting beacon present in the visual field than without the beacon. A) Distribution of color ratings among the 5 categories: red, yellow, green, blue, and white; shows increased green ratings accompanied by an increase in overall saturation (reduced white ratings). B) The magnitude of the hue shift is similar to that seen in the same two subjects with dimmer stimuli. Data with more intense stimuli were not acquired for other subjects. Points are labeled with subject number and represent the mean of all seen spots plus or minus 1 standard error. Note that only the central portion of the Uniform Appearance Diagram is shown.
