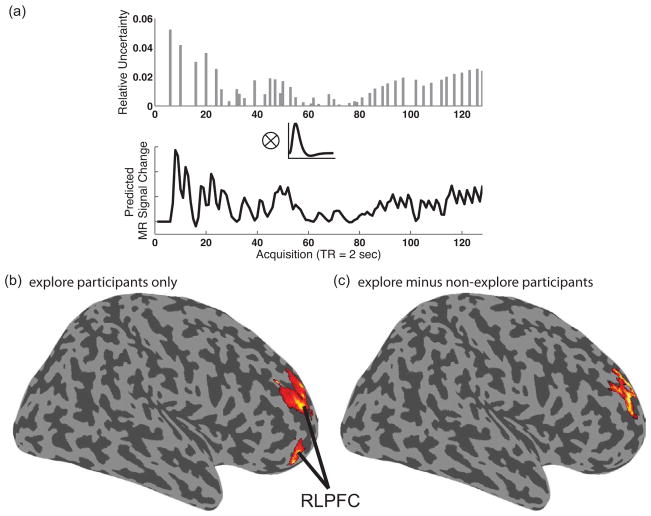
Figure 4.
Whole brain analysis of trial-to-trial changes in relative uncertainty. (a) Example individual subject relative uncertainty regressor from one run of one participant. Convolution of parametric changes in relative uncertainty (|σslow(t) − σfast(t)|) on each trial (top plot) with a canonical hemodynamic response function (middle plot) produced individual participant relative uncertainty regressors (bottom plot). (b) The effect of relative uncertainty, controlling for mean uncertainty and restricted to explore participants (ε > 0), revealed activation in dorsal and ventral RLPFC regions (rendered at p < .05 FWE corrected [cluster level]). (c) Contrast of relative uncertainty effect, controlling for mean uncertainty, in explore (ε > 0) versus non-explore (ε = 0) participants revealed a group difference in RLPFC (rendered at p < .05 FWE corrected [cluster level]).

