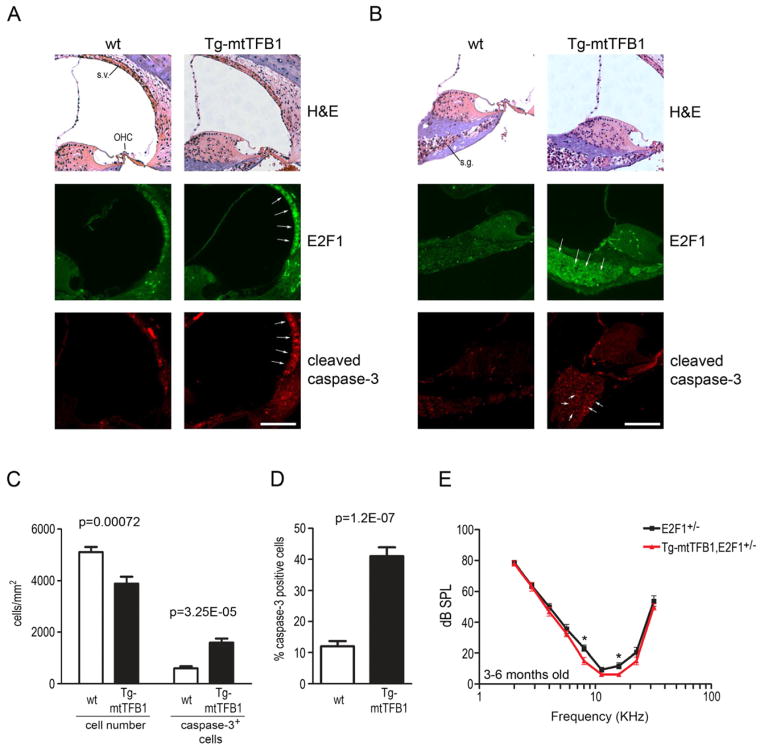
Figure 5. Deafness pathology in Tg-mtTFB1 mice involves up-regulation of E2F1 and apoptosis in the stria vascularis and spinal ganglion neurons of the inner ear.
(A) H&E staining of the organ of Corti and stria vascularis (top panels) from representative 1-year old wild-type (wt, left column) and Tg-mtTFB1 mice (right column). The middle panels show immunohistochemistry staining for E2F1 and the lower panels show immunohistochemistry for cleaved caspase-3 in similar representative sections. White arrows indicate areas where significant changes in signal are observed. Stria vascularis (s.v.), outer hair cells (OHC), scale bar, 100μm. See also Figure S2.
(B) same as in (A) but sections that highlight staining in the spiral ganglion neurons are shown. Spiral ganglion (s.g.), scale bar, 100μm.
(C) quantification of cellular density in the spiral ganglion (the left side of the plot) and of caspase-3 positive spiral ganglion neurons (right side). The sections were obtained from 3 wild-type and 3 Tg-mtTFB1 mice at 1 year of age, and six independent sections were counted for each animal. The values plotted represent mean ± standard deviation, with t-test p-values indicated.
(D) same as in (C), but expressing the percentage of caspase-3 positive cells in the spiral ganglion. The values plotted represent mean ± standard deviation, with t-test p-values indicated.
(E) ABR analysis of E2F1+/− mice (black points) and E2F1+/−/Tg-mtTFB1 mice (red points) performed as described in Figure 4C (n=). Mice were tested at ages 3–6 months (8 E2F1+/− mice and 10 E2F1+/−/Tg-mtTFB1 mice were used). The values plotted represent mean ± standard error of the mean, with t-test p-values indicated (*, p<0.05).

