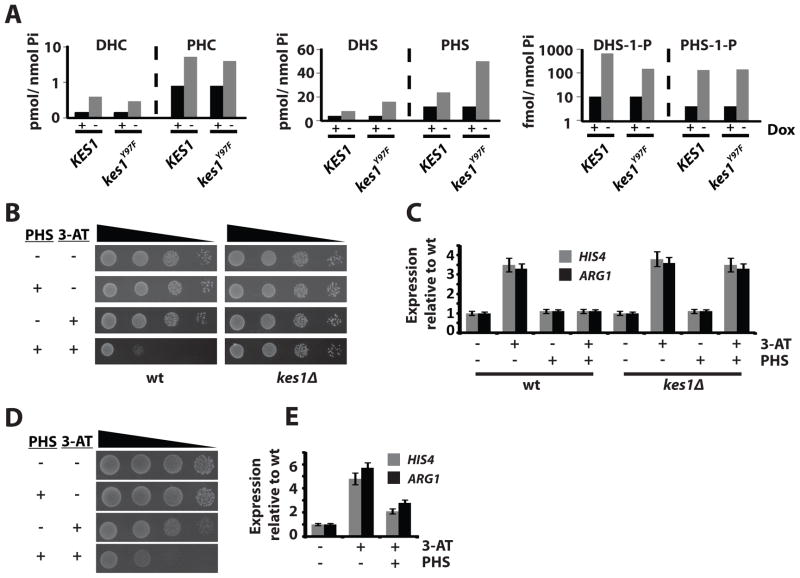
Figure 5.
Sphingolipids inhibit the GAAC. (A) Quantitative lipidomics of DHC, PHC, DHS, PHS, DHS-1-P and PHS-1-P in yeast (CTY182) as a function of Kes1 or Kes1Y97F expression. Note the log10 scale for the y-axis. (B) WT strain (CTY8-11Cα) and a kes1Δ derivative were spotted in a 10-fold dilution series on synthetic complete (SC) media and SC media with 7.5μM PHS, with 10mM 3-AT, or both. (C) Total RNA fractions were isolated from WT yeast either mock treated or grown in the presence of 7.5μM PHS for 2 hours. Cells were either mock-treated or challenged with 100mM 3-AT for 2 hours to induce the GAAC. HIS4, ARG1 and ACT1 expression were monitored by RT-PCR. Undiluted product and a 4-fold dilution of product were analyzed. Error bars represent standard deviation. (D) WT yeast (CTY8-11Cα) expressing Ura3 or Gcn4c were spotted in a 10- fold dilution series on SC media and SC media with 7.5μM PHS, with 10mM 3-AT, or both. (E) Total RNA fractions were prepared from WT yeast expressing Ura3 or Gcn4c +/− 15μM PHS for 2 hrs. HIS4 and ARG1 expression was surveyed by RT-PCR and normalized to ACT1 expression. Undiluted product and a 4-fold dilution of product were analyzed. Error bars represent standard deviation. Also see Suppl. Fig. S7.

