
Fig. 2.
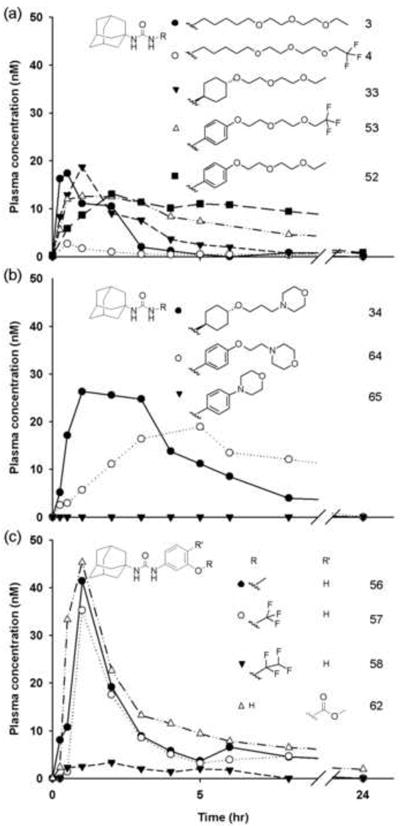
Plasma concentration-time profiles of sEH inhibitors with the adamantyl non-polar group and varied linker, polar group and R2 group after an oral dose of 0.3 mg/kgbody weight (n = 1). (a) Polyethylene glycol derivatives (● 3, ○ 4, ▼ 33, Δ 53 and ■ 52). (b) Heterocylic R2 group with varied linkers (● 34, ○ 64, and ▼ 65). (c) Phenyl linker with varied R2 groups (● 56, ○ 57, ▼ 58, and Δ 62). Each curve represents data from one dog (n = 1).