
Table 2.
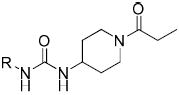
Substituted phenyl analogues
 | ||||
|---|---|---|---|---|
| IC50 (nM) | ||||
| Compd | R | Human | Murine | logP (±0.5) |
| 10 |
|
1,700 | >5,000 | 1.6 |
| 11 |
|
40 | 8.7 | 1.8 |
| 12 |
|
43 | 55 | 1.8 |
| 13 |
|
8.3 | 1.3 | 2.3 |
| 14 |

|
2.8 | 3.3 | 2.8 |
| 15 |
|
87 | 8.7 | 1.0 |
| 16 |
|
3.5 | 0.4 | 2.8 |
| 17 |
|
61 | 100 | 1.1 |
| 18 |

|
>5,000 | >5,000 | 0.8 |
| 19 |

|
2,000 | 650 | 0.2 |
| 20 |
|
38 | 97 | 1.7 |
| 21 |

|
140 | 64 | 1.6 |
| 22 |

|
330 | 1,000 | 0.4 |
| 23 |
|
406 | 1,400 | 0.0 |