
Table 3.
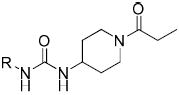
Halophenyl urea analogues
 | ||||
|---|---|---|---|---|
| IC50 (nM) | ||||
| Compd | R | Human | Murine | logP (±0.5) |
| 24 |
|
79 | 110 | 1.4 |
| 25 |
|
10 | 23 | 2.2 |
| 26 |
|
3.6 | 15 | 2.4 |
| 27 |
|
7.2 | 1.4 | 2.5 |
| 28 |
|
39 | 20 | 1.7 |
| 29 |
|
300 | 780 | 1.6 |
| 30 |
|
21 | 6.6 | 2.2 |
| 31 |
|
1100 | 2900 | 2.0 |
| 32 |
|
3.4 | 0.6 | 2.9 |
| 33 |

|
0.4 | 1.0 | 3.3 |
| 34 |
|
>5,000 | >5,000 | 1.3 |
| 35 |
|
4.1 | 2.3 | 3.0 |
| 36 |
|
0.7 | 6.5 | 2.4 |
| 37 |
|
17 | 8.8 | 2.4 |
| 38 |

|
0.4 | 0.7 | 3.5 |
| 39 |

|
17 | 28 | 3.8 |
| 40 |
|
3.7 | 2.8 | 2.5 |