
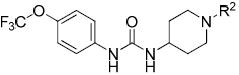
Table 4.
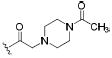
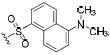
N-Acyl and N-sulfonyl piperidine analogues
 | ||||
|---|---|---|---|---|
| IC50 (nM) | ||||
| Compd | R2 | Human | Murine | logP (±0.5) |
| 47 |

|
0.7 | 1.3 | 2.4 |
| 48 |

|
0.6 | 0.7 | 2.9 |
| 49 |
|
3.1 | 5.0 | 2.6 |
| 50 |
|
1.5 | 18 | 3.8 |
| 51 |
|
0.5 | 1.2 | 2.4 |
| 52 |
|
0.4 | 0.4 | 2.7 |
| 53 |
|
0.4 | 0.4 | 3.1 |
| 54 |

|
0.5 | 2.7 | 2.0 |
| 55 |
|
2.9 | 2.0 | 2.2 |
| 56 |
|
0.4 | 0.7 | 2.6 |
| 57 |

|
1.8 | 0.4 | 3.1 |
| 58 |

|
0.4 | 0.4 | 3.5 |
| 59 |
|
0.8 | nda | 4.3 |
a
nd = Not determined