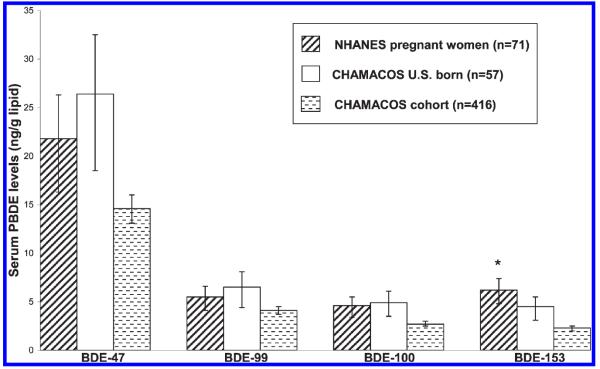
Figure 1.
Comparison of adjusted GM PBDE congener levels among pregnant women in NHANES and the CHAMACOS cohort. Asterisk indicates significant comparison between entire CHAMACOS cohort (n = 416) and pregnant women in NHANES (from multivariable regression models adjusting for age, race and SES; p < 0.05). The error bars represent the 95% confidence interval.

