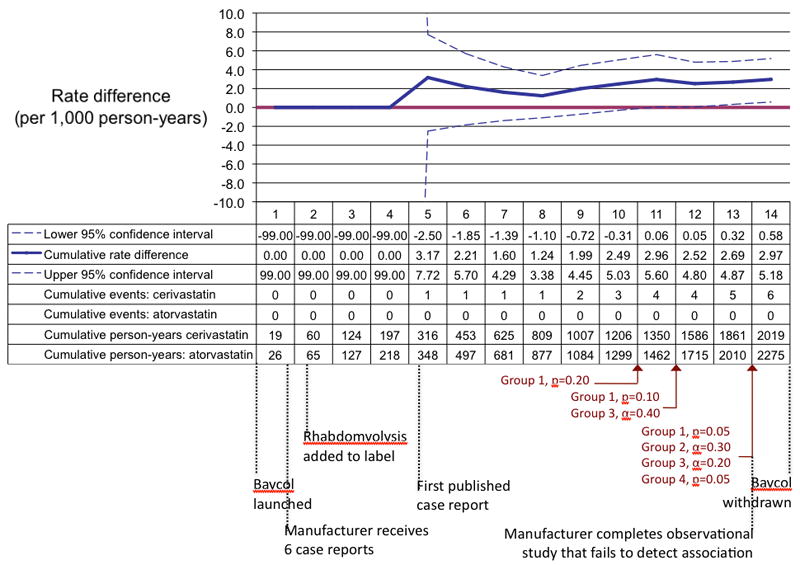
FIGURE 3.

A reproduction of prospective monitoring of cerivastatin and rhabdomyolysis using retrospective data from two electronic healthcare databases from 1998 to 2001. In each monitoring period the numbers are updated in a cumulative fashion based on the data that became available during the corresponding calendar quarter. The black text below the table shows when each milestone in the history of this example occurred in relation to our monitoring periods.12
