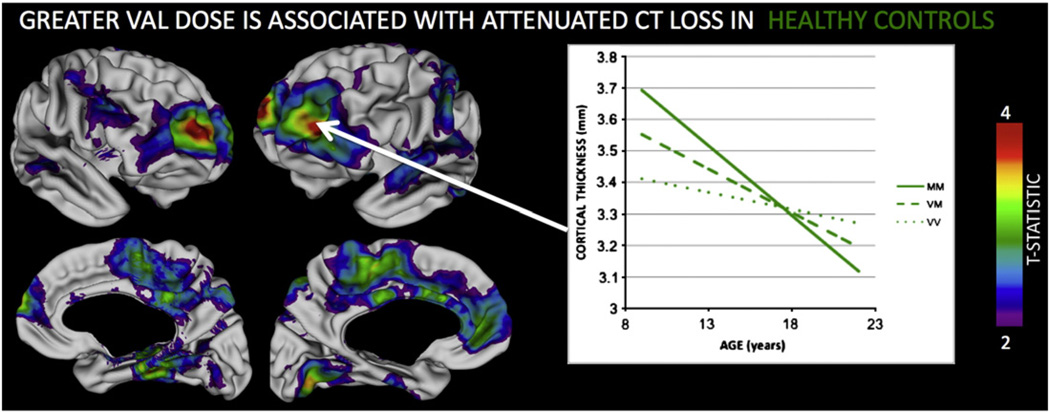
Fig. 1.
Lateral and medial views of the cortical surface summarizing regions where Val158Met genotype was associated with significant (FDR corrected q < 0.05) difference in the rate of CT loss in Healthy Controls (HCs). Colored regions indicate where HCs show a step-wise reduction in the rate of CT loss for each extra Val allele. The inset plot illustrates this for the left dorsolateral prefrontal cortex.

