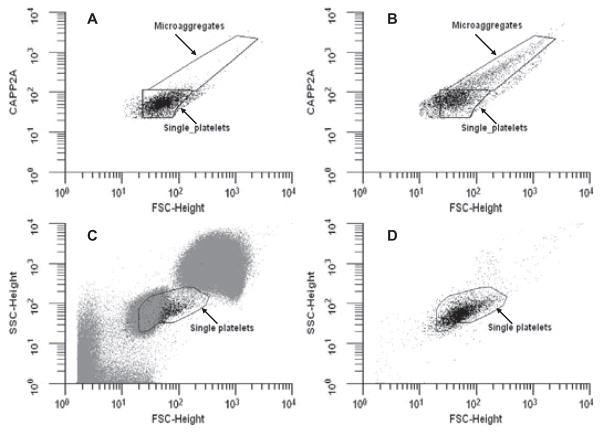
FIG. 1.
(A) CAPP2A binding versus FSC for individual scattering events is displayed identifying ovine platelets for an unstimulated sample. (B) Scatter plot of ovine platelets gating with CAPP2A fluorescence and FSC for a 10-μM PAF-stimulated sample. Microaggregates bind more CAPP2A and have a higher FSC than single platelets. (C) FSC versus SSC plot for ovine blood cells. The region labeled “single platelets” is where platelets typically reside on such a plot. (D) FSC versus SSC plot of ovine platelets identified with CAPP2A. There are a number of cells in the single platelet region of panel C that are not in the same region in panel D, suggesting that these cells are not positive for CAPP2A and should not be considered platelets.

