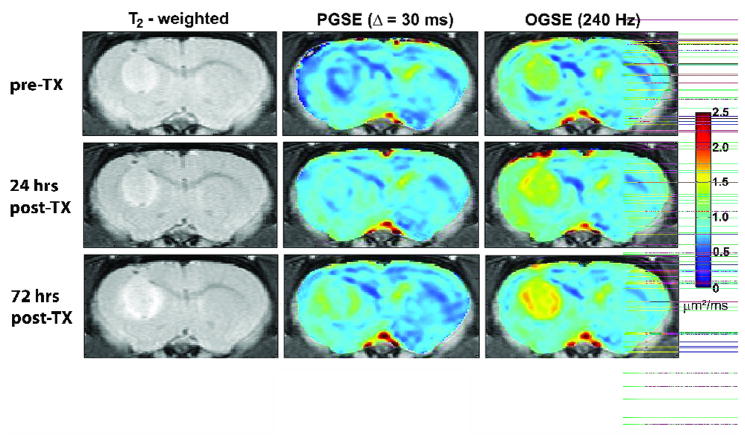
Fig. 1.
ADC maps illustrating the variation in structure of 9L tumors 24 hours and 72 hours following treatment with BCNU. The center column depicts ADC maps obtained with conventional methods, while those in the right column show results obtained with OGSE techniques (240 Hz). A corresponding color-bar representing ADC values is also shown.

