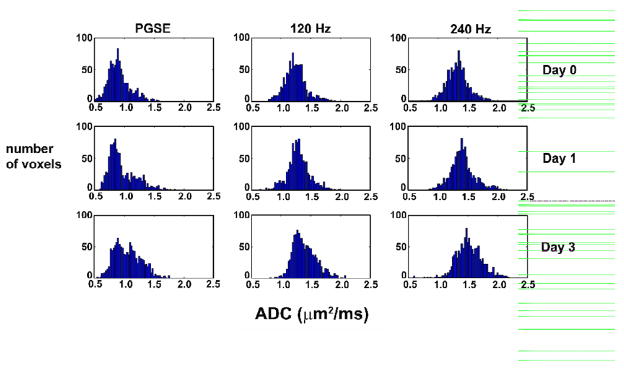
Fig. 2.
Histogram of ADC values in a whole tumor region of interest for one representative animal treated with BCNU. This figure illustrates the range of ADC values obtained within one tumor, as well as the increase in ADC following treatment. The values for PGSE are clearly lower than those obtained with OGSE techniques.

