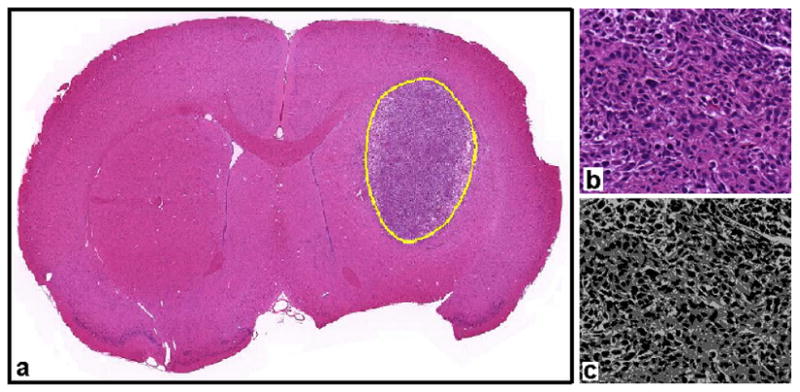
Fig. 5.

Example of histological data analysis. Whole tumor regions of interest were drawn for each sectioned tissue sample, as shown in panel (a). A close-up of one region of the tumor is shown in panel (b). A k-means clustering algorithm was used to segment H&E stained images into three regions representing the intra-nuclear, cytoplasmic, and extracellular components of the cellular space (panel (c)).
