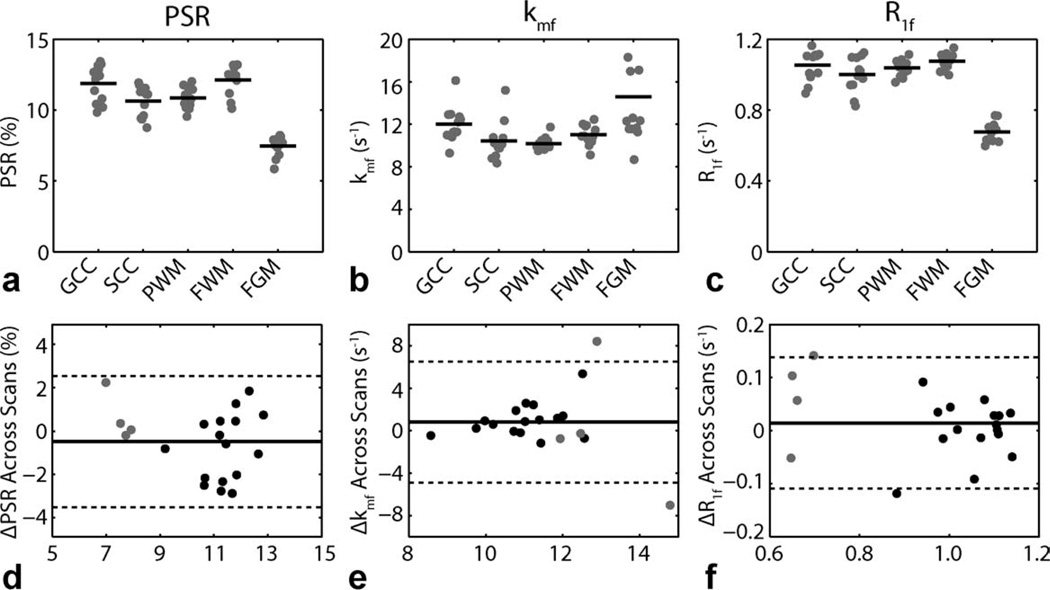
FIG. 4.
ROI-based qMT parameters for the ROIs defined in Fig. 3. (top row) Mean ROI qMT parameters [PSR (a), kmf (b), R1f (c)] for each healthy volunteer (gray dot) as well as the mean across volunteers (black bar). Results from all 13 scans are shown (nine subjects, four scanned twice). Legend: genu of the corpus callosum (GCC), the splenium of the corpus callosum (SCC), parietal WM (PWM), frontal WM (FWM), and frontal GM (FGM). (bottom row) Bland–Altman plots of difference in qMT parameters [ΔPSR (d), Δkmf (e), ΔR1f (f)] for WM (black dots) and GM (gray dots) ROIs across scans. The solid lines represent the mean difference across scans for all ROIs, and the dashed lines represent the limits of agreement (mean difference ± 1.96 SD).

