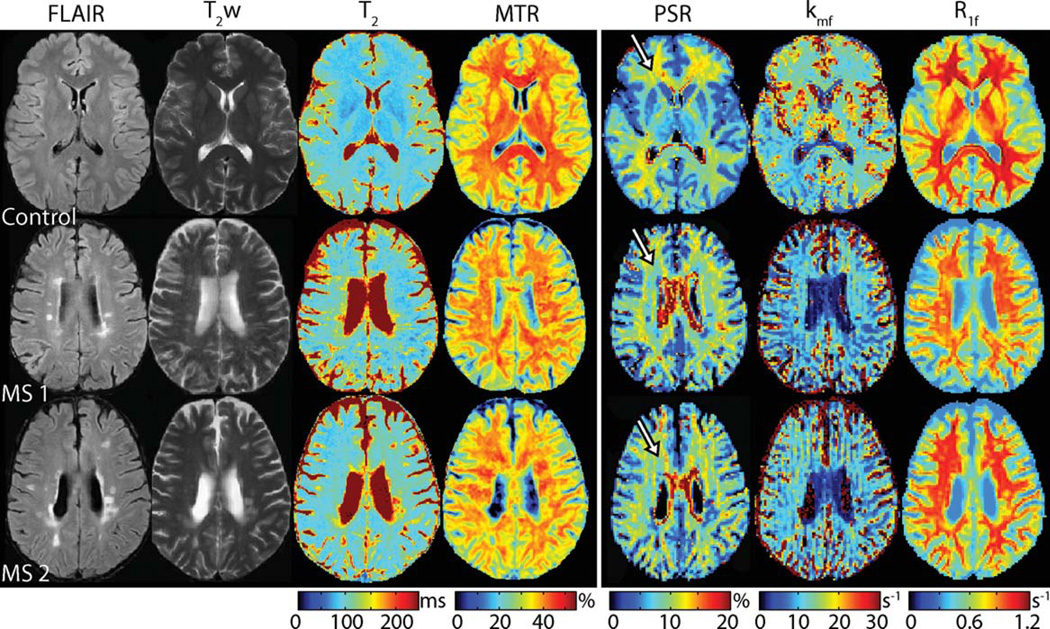
FIG. 5.
Multiparametric clinical imaging data (FLAIR, T2w, T2, and MTR) and colocalized qMT parameter maps (PSR, kmf, and R1f) from a healthy control and two RRMS patients (top to bottom). Note the focal changes in all three qMT parameters within lesions identified in the conventional images. Furthermore, note the decrease in PSR, kmf, and R1f in RRMS patients relative to healthy controls in normal appearing WM. For example, a decrease in PSR is observed within periventricular FWM regions (see arrows) in MS patients (blue hues in PSR map) relative to the healthy control (yellow hues in PSR map).

