
Figure 1.
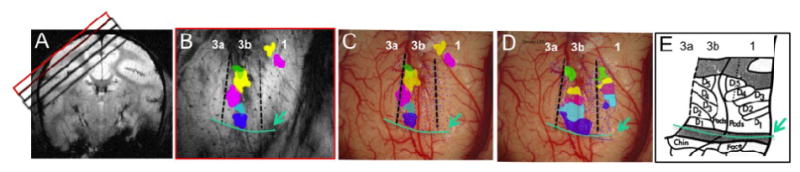
FMRI and electrophysiology of SI cortex of squirrel monkeys. A: Four oblique imaging slices (red and black boxes) are obtained from SI (top slice, red box) and deeper brain regions. B: Composite map of individual digit activations to tactile stimulus shows order representation of D1 (blue patch), D2 (light blue patch), D3 (violet patch), D4 (yellow patch) and D5 (green patch) in a lateral to medial order in area 3b. Dotted black lines indicate the estimated inter-areal borders. Green line and arrow indicate the hand-face border. C: Overlay of fMRI activation map of digits (same color scheme) and dense electrophysiology maps (blue dots indicate the electrode penetration sites). D: Digit representation territories in areas 3b and 1 as determined by receptive field properties and preferred stimuli. E. Digit representation map and organization in areas 3b and 1 as established by using electrophysiological and histologic evidence. Adapted from [46]. a: anterior; m: middle; I: lateral; p: posterior.