
Figure 2.
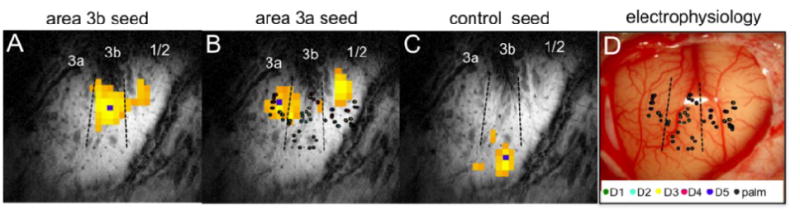
Differential functional connectivity revealed within areas 3a, 3b, 1/2 of SI cortex in anesthetized monkey. A: highly correlated area at area 1 considering single most activated voxel in area 3b as the seed (small blue square), but low correlation with area 3a. B: connectivity map from seed location in 3a. C: connectivity profile for a control face region. D: exposed slice showing blood vessels and location of electrodes used to map digit fields.